
JEE Advanced 2026 Paper 2, Chemistry Section 2 Q1: Reactions of Various Orders
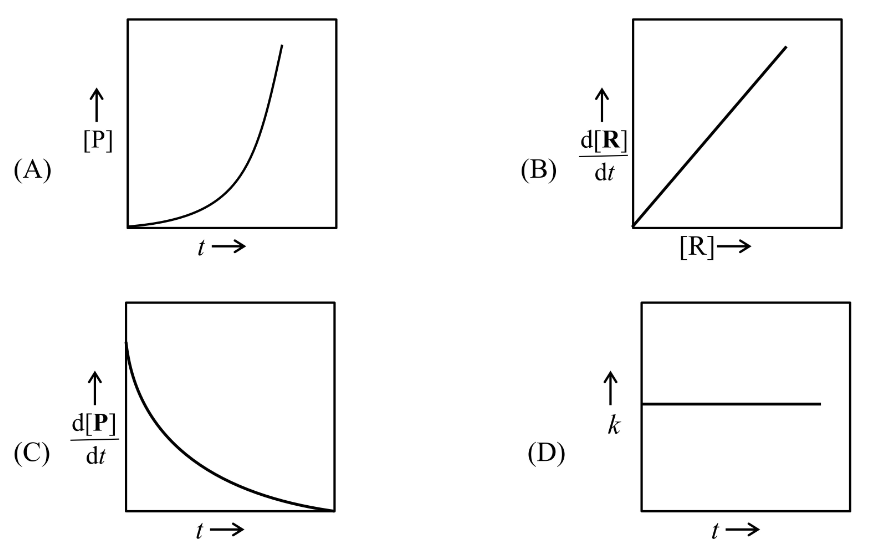
For a first-order reaction at a given temperature, is the rate constant. For this reaction, at the given temperature, the concentrations of and at a time are and , respectively. The correct graphical representation(s) for this reaction is(are)
- A
(A)
- B
(B)
- C
(C)
- D
(D)
(A) vs . For a first-order reaction starting from and no product:
.
This curve rises from zero and asymptotically approaches from below (concave down, saturating). The exponential-growth shape shown in option (A) is wrong. Incorrect.
(B) vs . Rate of disappearance: , so
.
The slope is negative, so the correct line lies in the fourth quadrant (negative , positive ), not the first. Incorrect.
(C) vs . Since , this quantity starts at and decays exponentially to zero. The shape matches. Correct.
(D) vs . The rate constant depends only on temperature, not on time, so the plot is a horizontal line. Correct.
Correct options are (C) and (D).
Concept behind this question
Reactions of Various OrdersNotes, formulas and examples →More previous year questions on Reactions of Various Orders
Practice more Chemistry Section 2
Concept-wise practice with instant solutions on Fundamenthol.
Start practicing →