
JEE Main2019Chemistry
Q.
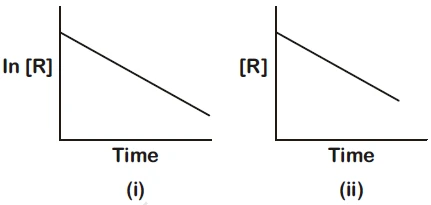
The given plots represent the variation of the concentration of a reactant R with time for two different reactions (i) and (ii). The respective orders of the reactions are
- A
0, 1
- B
1, 1
- C
1, 0
- D
0, 2
Solution
Graph-(i) : In[Reactant] vs time is linear Hence, 1st order.
Graph-(ii) : [Reactant] vs time is linear Hence, zero order.
Practice more Chemistry
Concept-wise practice with instant solutions on Fundamenthol.
Start practicing →