
JEE Main 2025 Apr 2 Shift 2, Chemistry Q18: Gibbs Energy Change and Equilibrium
JEE Main2025Apr 2, Shift 2Chemistry
Q.
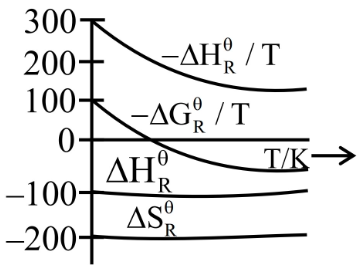
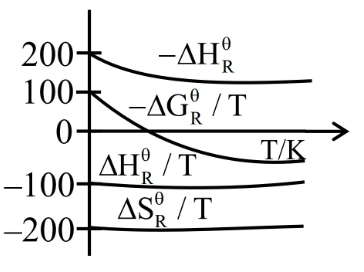
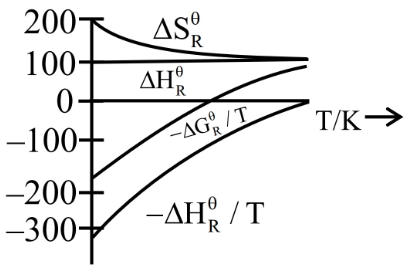
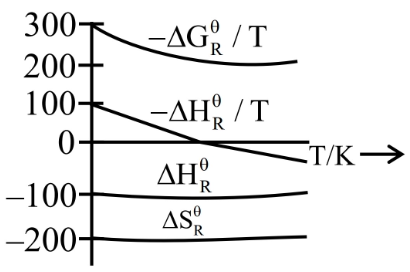
Which of the following graphs correctly represents the variation of thermodynamic properties of Haber's process ?
- A
- B
- C
- D
Solution
For Haber's process , the moles of gas decrease, so . The forward reaction is exothermic, so .
Both and are essentially temperature-independent over a moderate range, so they appear as nearly horizontal lines in the negative region.
Since is negative, is positive and decreases with increasing (a curve approaching zero from above).
From , dividing by gives . With , this lies below the curve and eventually becomes negative at high T.
Plot (1) shows exactly this behaviour.
Concept behind this question
Gibbs Energy Change and EquilibriumNotes, formulas and examples →More previous year questions on Gibbs Energy Change and Equilibrium
Practice more Chemistry
Concept-wise practice with instant solutions on Fundamenthol.
Start practicing →