
JEE Main 2026 Jan 28 Shift 1, Physics Q8: Change of State And Calorimetry
JEE Main2026Jan 28, Shift 1Physics
Q.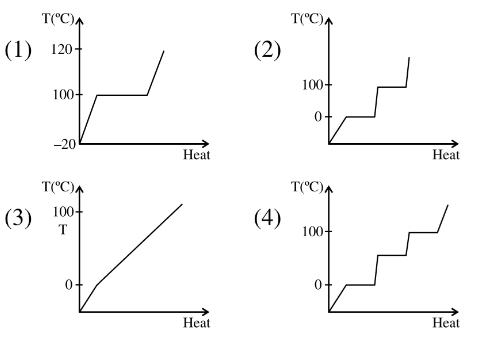
Which of the following best represents the temperature versus heat supplied graph for water, in the range of C to C ?
- A
Graph (1)
- B
Graph (2)
- C
Graph (3)
- D
Graph (4)
Solution
Sketch the expected T-vs-heat curve in five stages:
1. Ice warming from to C: linear rise (slope ).
2. Melting at C: horizontal plateau of width .
3. Water warming C: linear rise (smaller slope since ).
4. Boiling at C: horizontal plateau of width , much longer than the melting plateau ().
5. Steam warming C: linear rise.
The graph showing this sequence with the correct relative plateau lengths is option (2).
Concept behind this question
Change of State And CalorimetryNotes, formulas and examples →More previous year questions on Change of State And Calorimetry
Practice more Physics
Concept-wise practice with instant solutions on Fundamenthol.
Start practicing →