
JEE Main 2025 Apr 2 Shift 1, Chemistry Q4: Vapour Pressure Of A Solution
Which of the following graph correctly represents the plots of at 1 bar gases in water versus temperature ?
- A
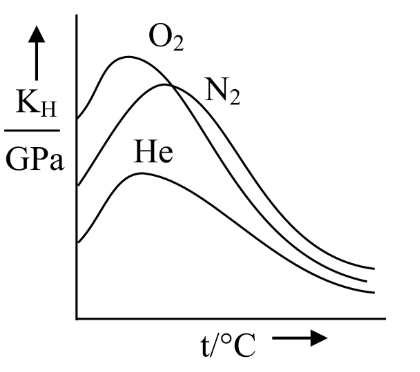
- B
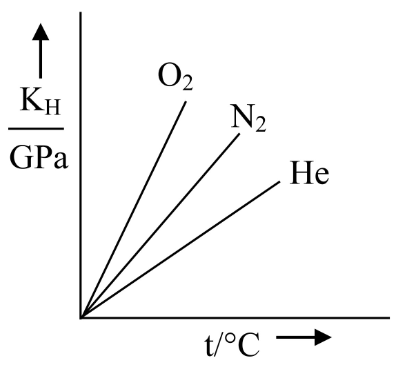
- C
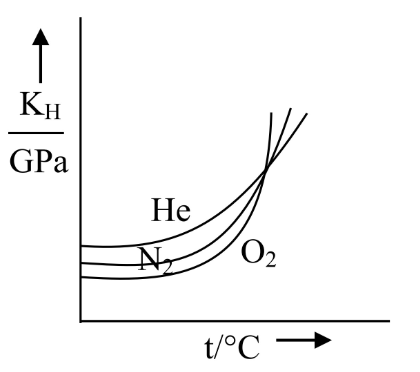
- D
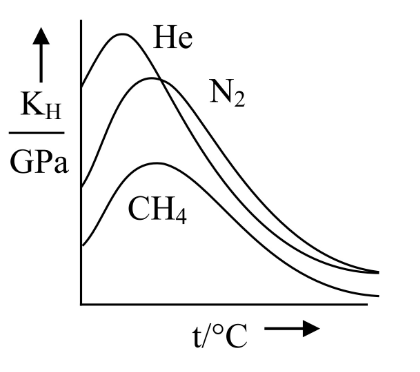
Henry's law constant is inversely related to gas solubility. The solubility of most gases in water first decreases with rising temperature (gas escapes as kinetic energy grows), then increases at higher temperatures for some gases due to changing hydration behaviour. Consequently first increases and then decreases, producing a curve with a maximum.
At moderate temperatures the magnitude of reflects how poorly soluble the gas is. Among the species in the options, the ordering of is:
The graph that shows three peaked curves with He highest, in the middle and lowest matches option (4).
Concept behind this question
Vapour Pressure Of A SolutionNotes, formulas and examples →More previous year questions on Vapour Pressure Of A Solution
Practice more Chemistry
Concept-wise practice with instant solutions on Fundamenthol.
Start practicing →