
JEE Main 2026 Jan 21 Shift 1, Chemistry Q18: Basic Concepts of Thermodynamic
JEE Main2026Jan 21, Shift 1Chemistry
Q.
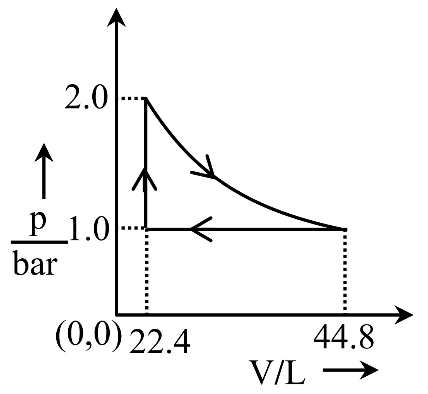
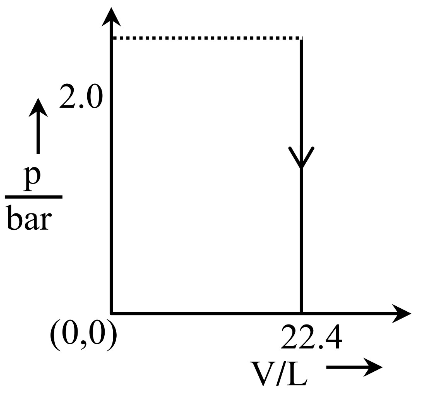
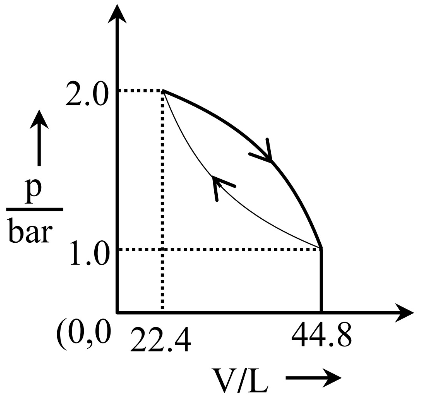
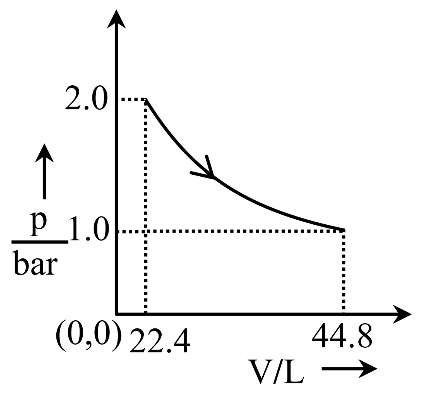
Which of the following graphs between pressure 'P' versus volume 'V' represent the maximum work done?
- A
- B
- C
- D
Solution
Work done in a P-V process equals magnitude of area under the P-V curve. Option (2) has zero work (isochoric). Option (4) has the largest area — maximum work magnitude. (NTA reported answer ignores sign convention.)
Concept behind this question
Basic Concepts of ThermodynamicNotes, formulas and examples →More previous year questions on Basic Concepts of Thermodynamic
Practice more Chemistry
Concept-wise practice with instant solutions on Fundamenthol.
Start practicing →