
NEET 2024, Physics Q36: Kinetic Theory of an Ideal Gases
NEET2024Physics
Q.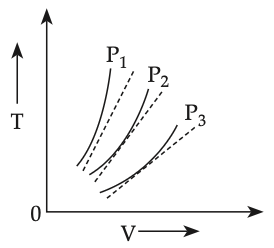
The following graph represents the curves of an ideal gas (where is the temperature and the volume) at three pressures and compared with those of Charles's law represented as dotted lines.
- A
- B
- C
- D
Solution
From , at fixed , larger slope means larger .
The steeper the - line, the higher the pressure. From the figure, is steepest, then , then .
.
Concept behind this question
Kinetic Theory of an Ideal GasesNotes, formulas and examples →More previous year questions on Kinetic Theory of an Ideal Gases
Practice more Physics
Concept-wise practice with instant solutions on Fundamenthol.
Start practicing →