
JEE Main 2025 Apr 7 Shift 1, Chemistry Q17: Reactions of Various Orders
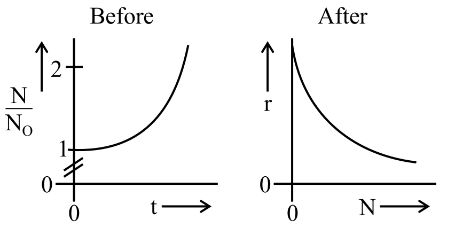
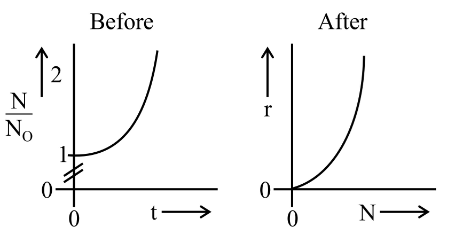
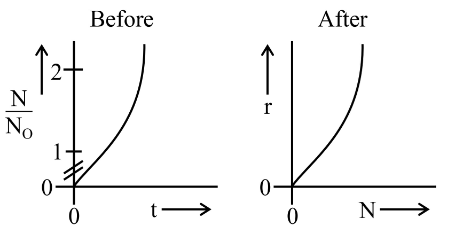
A person's wound was exposed to some bacteria and then bacteria growth started to happen at the same place. The wound was later treated with some antibacterial medicine and the rate of bacterial decay (r) was found to be proportional with the square of the existing number of bacteria at any instance. Which of the following set of graphs correctly represents the 'before' and 'after' situation of the application of the medicine?
[Given : N = No. of bacteria, t = time, bacterial growth follows I order kinetics.]
- A
- B
- C
- D
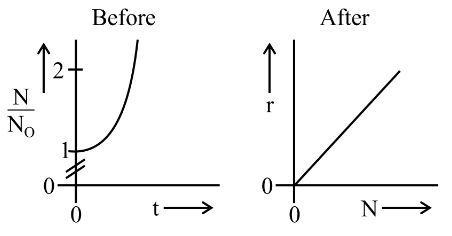
Before treatment (growth, first order in N):
So versus is an exponential rise starting from 1 at .
After treatment (decay, second order in N):
So versus is a parabola of the form , passing through the origin and opening upward.
The graph set that shows an exponential rise for 'Before' and a rising parabola for 'After' is Option (2).
Concept behind this question
Reactions of Various OrdersNotes, formulas and examples →More previous year questions on Reactions of Various Orders
Practice more Chemistry
Concept-wise practice with instant solutions on Fundamenthol.
Start practicing →