
JEE Main 2025 Jan 24 Shift 1, Chemistry Q17: Colligative Properties
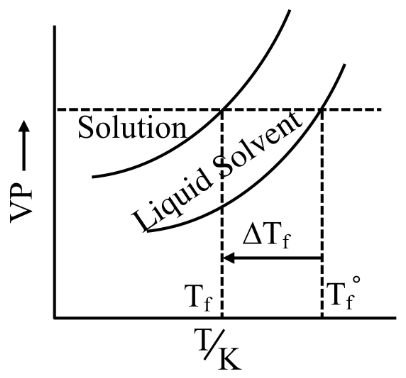
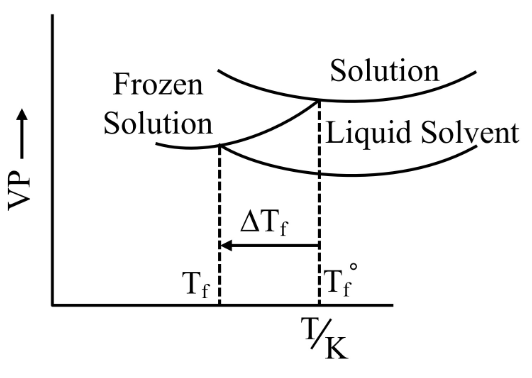
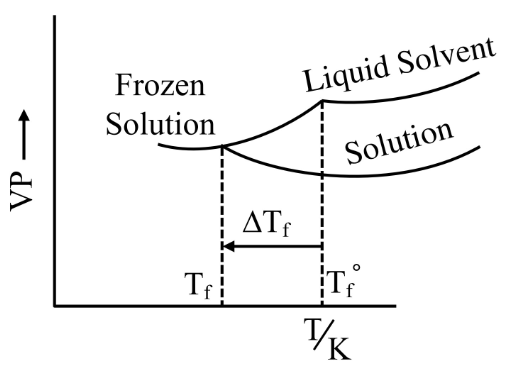
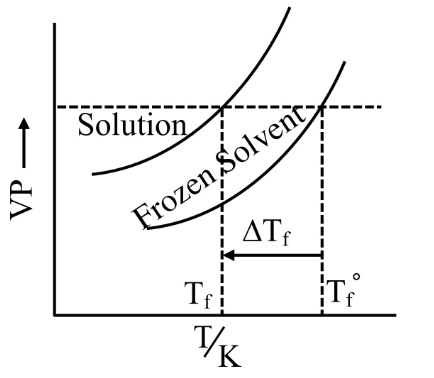
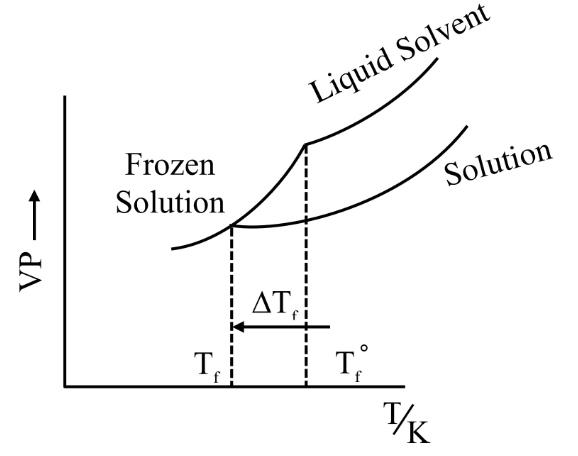
Consider the given plots of vapour pressure (VP) vs temperature (T/K). Which amongst the following options is correct graphical representation showing , depression in the freezing point of solvent in a solution ?
- A
- B
- C
- D
Two ideas fix the picture:
1. Adding a non-volatile solute lowers the vapour pressure of the liquid at any given temperature, so the curve for the solution lies below the curve for the pure liquid solvent.
2. Freezing point is defined where the vapour pressure of the liquid phase equals that of the solid phase (the frozen-solvent curve). Because the solution's liquid curve is depressed, it meets the solid-solvent curve at a lower temperature.
Therefore the correct sketch must show:
(i) the liquid-solvent curve above the solution curve, and
(ii) the freezing point of the solution lying to the left of the pure solvent's freezing point , with .
Option (3) shows the liquid-solvent curve above the solution curve and the frozen-solution curve meeting them at the lower . Option (3).
Concept behind this question
Colligative PropertiesNotes, formulas and examples →More previous year questions on Colligative Properties
Practice more Chemistry
Concept-wise practice with instant solutions on Fundamenthol.
Start practicing →