
NEET 2022, Chemistry Q20: Basic Concepts of Thermodynamic
NEET2022Chemistry
Q.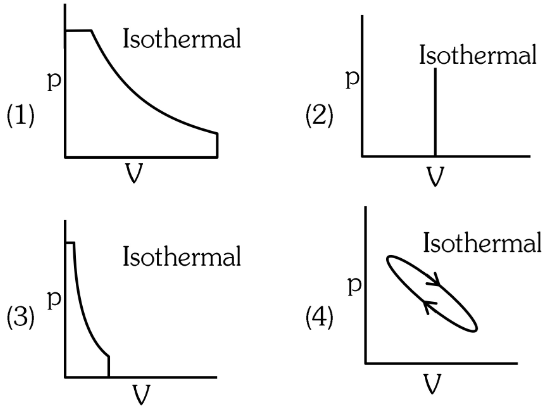
Which of the following p-V curve represents maximum work done ?
- A
Option 1
- B
Option 2
- C
Option 3
- D
Option 4
Solution
For a process on a p-V diagram, the magnitude of the work done by or on the gas is given by the area enclosed under the curve, .
The graph in option (1) sweeps out the largest area between the curve and the V-axis, so it represents the maximum work.
Concept behind this question
Basic Concepts of ThermodynamicNotes, formulas and examples →More previous year questions on Basic Concepts of Thermodynamic
Practice more Chemistry
Concept-wise practice with instant solutions on Fundamenthol.
Start practicing →