
NEET 2022, Physics Q14: Wave Nature of Matter
NEET2022Physics
Q.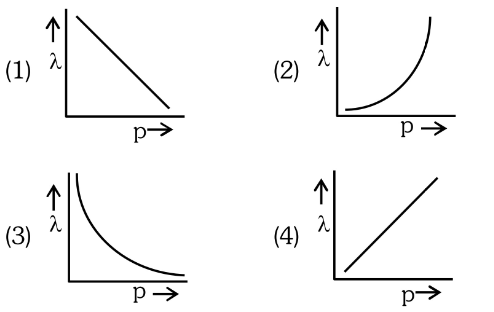
The graph which shows the variation of the de Broglie wavelength () of a particle and its associated momentum (p) is :
- A
1
- B
2
- C
3
- D
4
Solution
de Broglie relation: , so is inversely proportional to .
The graph of versus is therefore a rectangular hyperbola decreasing from large values toward zero.
Concept behind this question
Wave Nature of MatterNotes, formulas and examples →More previous year questions on Wave Nature of Matter
Practice more Physics
Concept-wise practice with instant solutions on Fundamenthol.
Start practicing →